
If you’re thinking of starting a blog or niche website, you’re probably curious about how much it can potentially earn.
While every website is different, so too is every niche and site operator. The entire process of building a blog is incredibly nuanced.
There is NO framework that can guarantee absolute success, but this one mega course comes really close, in my opinion.
With that said, I’ve created this blogging income report series to help track my personal journey. Your journey could be very different.
NOTE: This income report does NOT include any income from my Minted Empire brand (this blog, my newsletter, and my YouTube Channel). Minted Empire is something I do in my spare time, and any income I earn here usually ends up being reinvested into my niche sites.
Let’s dive in!
Overview of January 2023’s Performance
With the last half of 2022 being full of Google Updates that shook up the content publishing world, early 2023 is also very eventful with AI developments.
I won’t get into any of that here.
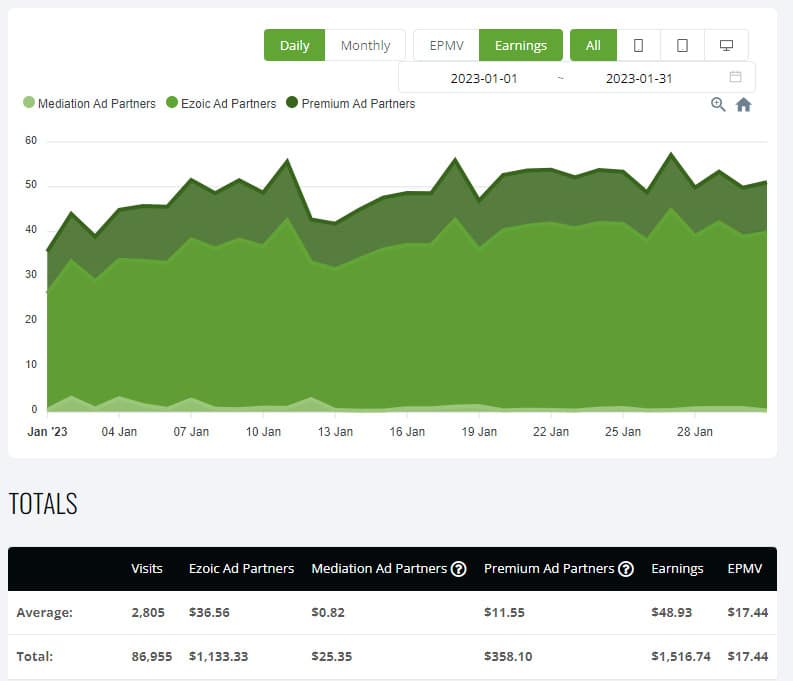
January is known for being a rough time for ad rates. So, despite traffic going up a bit in January, the ad and affiliate earnings went down.
This was only felt by a single site (#1), earnings are way down despite no drop in traffic. I do think seasonality played a part too.
However, I did sell 2 sites, so if you count the sales proceeds for that deal flow, then January was actually a decent month. These income reports are only focused on the day to day earnings though, so I won’t get into the sale talk here. (Perhaps another time!)
So, when looking at just the day to day income for January, it wasn’t a great month compared to other months. I’m down a good bit.
Site Breakdown
This income report covers 5 3 websites because I sold 2 recently.
I now have 4 sites that I’m actively working on. The latest site has only earned a small amount and isn’t part of my income reports yet. I’ll add it to next month’s report just so you can start tracking it.
(If you don’t want to read the detailed breakdown for each site, you can skip ahead to the summary.)
Site 1: Performance Report
Started: June 2020
Niche: Hobby / Tech
Monetization: Display Ads (Ezoic) & Affiliate (mostly Amazon Associates)
| Month | New Posts | Total Posts | Pageviews | Ads $ | Affiliate $ | Total $ |
| Jun ’20 | 3 | 3 | 202 | – | – | – |
| Jul ’20 | – | 3 | 336 | – | – | – |
| Aug ’20 | 4 | 7 | 48 | – | – | – |
| Sep ’20 | – | 7 | 22 | – | – | – |
| Oct ’20 | – | 7 | 54 | – | – | – |
| Nov ’20 | 1 | 8 | 254 | – | – | – |
| Dec ’20 | 2 | 10 | 271 | – | – | – |
| Jan ’21 | 6 | 16 | 434 | $1 | – | $1 |
| Feb ’21 | 6 | 22 | 536 | $3 | – | $3 |
| Mar ’21 | 7 | 29 | 2,643 | $14 | $1 | $15 |
| Apr ’21 | 11 | 40 | 4,504 | $34 | $46 | $80 |
| May ’21 | 10 | 50 | 7,601 | $67 | $382 | $449 |
| Jun ’21 | 5 | 55 | 7,117 | $80 | $286 | $366 |
| Jul ’21 | 0 | 55 | 9,534 | $125 | $383 | $508 |
| Aug ’21 | 4 | 59 | 12,903 | $148 | $394 | $542 |
| Sep ’21 | 0 | 59 | 15,336 | $175 | $406 | $581 |
| Oct ’21 | 3 | 62 | 16,735 | $206 | $701 | $907 |
| Nov ’21 | 28 | 90 | 19,458 | $346 | $376 | $722 |
| Dec ’21 | 62 | 152 | 14,170 | $280 | $473 | $753 |
| Jan ’22 | 36 | 188 | 12,713 | $173 | $210 | $383 |
| Feb ’22 | 1 | 189 | 10,899 | $137 | $348 | $485 |
| Mar ’22 | – | 189 | 13,587 | $154 | $516 | $670 |
| Apr ’22 | 4 | 193 | 21,844 | $184 | $430 | $614 |
| May ’22 | 30 | 223 | 29,626 | $305 | $347 | $652 |
| Jun ’22 | 23 | 246 | 30,894 | $492 | $499 | $991 |
| Jul ’22 | 12 | 258 | 39,760 | $546 | $830 | $1,376 |
| Aug ’22 | 5 | 263 | 45,232 | $731 | $671 | $1,402 |
| Sep ’22 | 10 | 273 | 43,012 | $917 | $609 | $1,526 |
| Oct ’22 | 17 | 290 | 39,881 | $860 | $905 | $1,765 |
| Nov ’22 | 5 | 295 | 35,150 | $985 | $1,130 | $2,116 |
| Dec ’22 | 1 | 296 | 37,227 | $720 | $1,465 | $2,186 |
| Jan ’23 | 3 | 299 | 38,570 | $468 | $505 | $973 |
What a dip in earnings considering that traffic went up slightly!
Site 2: Performance Report
Started: September 2020
Niche: Lifestyle
Monetization: Display Ads (Ezoic), Other Affiliate
| Month | New Posts | Total Posts | Pageviews | Ads $ | Affiliate $ | Total $ |
| Sep ’20 | 10 | 10 | 142 | – | – | – |
| Oct ’20 | 10 | 20 | 571 | $1 | – | $1 |
| Nov ’20 | – | 20 | 466 | $4 | – | $4 |
| Dec ’20 | – | 20 | 542 | $9 | $5 | $14 |
| Jan ’21 | 1 | 21 | 499 | $5 | $1 | $6 |
| Feb ’21 | 6 | 27 | 513 | $5 | $4 | $9 |
| Mar ’21 | 4 | 31 | 1,627 | $7 | $1 | $8 |
| Apr ’21 | – | 31 | 2,492 | $12 | $32 | $44 |
| May ’21 | 6 | 37 | 3,690 | $41 | $67 | $108 |
| Jun ’21 | 7 | 44 | 3,938 | $53 | $63 | $116 |
| Jul ’21 | 12 | 56 | 5,870 | $91 | $7 | $98 |
| Aug ’21 | 1 | 57 | 6,529 | $92 | $17 | $109 |
| Sep ’21 | – | 57 | 6,367 | $91 | $3 | $94 |
| Oct ’21 | – | 57 | 6,503 | $91 | $7 | $98 |
| Nov ’21 | – | 57 | 6,114 | $110 | $106 | $216 |
| Dec ’21 | – | 57 | 4,919 | $88 | – | $88 |
| Jan ’22 | – | 57 | 6,618 | $110 | $36 | $146 |
| Feb ’22 | 3 | 60 | 6,473 | $90 | $35 | $125 |
| Mar ’22 | 16 | 76 | 8,115 | $96 | $1 | $97 |
| Apr ’22 | 7 | 83 | 9,219 | $134 | $61 | $195 |
| May ’22 | 6 | 89 | 13,639 | $223 | $33 | $256 |
| Jun ’22 | 8 | 97 | 18,779 | $350 | $172 | $522 |
| Jul ’22 | 7 | 104 | 21,624 | $354 | $96 | $450 |
| Aug ’22 | 1 | 105 | 28,694 | $593 | $46 | $639 |
| Sep ’22 | 7 | 112 | 35,042 | $1,043 | $40 | $1,083 |
| Oct ’22 | 9 | 121 | 29,316 | $766 | $156 | $922 |
| Nov ’22 | 1 | 122 | 17,316 | $477 | $119 | $597 |
| Dec ’22 | – | 122 | 12,211 | $241 | $51 | $292 |
| Jan ’23 | – | 122 | 15,514 | $266 | $73 | $339 |
This is a seasonal site. I’m currently in middle of re-branding. I’ll be moving it to a new domain and power-boosting with an aged domain redirect as well as a link-bait campaign. If you’re following along via my newsletter, you’ll find out more.
Site 3: SOLD!
Site 4: SOLD!
Site 5: Performance Report
Started: January 2022 (with some seed content posted during Summer 2021)
Niche: Not disclosed!
Monetization: Display Ads (Ezoic)
| Month | New Posts | Total Posts | Pageviews | Ads $ | Affiliate $ | Total $ |
| Summer ’21 | 46 | 46 | 6,654 (July to Dec ’21) | – | – | – |
| Jan ’22 | 42 | 88 | 1,849 | – | – | – |
| Feb ’22 | 106 | 194 | 2,178 | – | – | – |
| Mar ’22 | 27 | 221 | 3,063 | – | – | – |
| Apr ’22 | 7 | 228 | 4,559 | $91 | – | $91 |
| May ’22 | 19 | 247 | 5,704 | $154 | – | $154 |
| Jun ’22 | 39 | 286 | 7,469 | $244 | – | $244 |
| Jul ’22 | 32 | 318 | 12,675 | $348 | $56 | $404 |
| Aug ’22 | 23 | 341 | 23,562 | $568 | $49 | $616 |
| Sep ’22 | 28 | 369 | 24,240 | $766 | $49 | $815 |
| Oct ’22 | 34 | 403 | 26,081 | $862 | $107 | $969 |
| Nov ’22 | 7 | 410 | 24,027 | $926 | $8 | $934 |
| Dec ’22 | 2 | 412 | 23,765 | $678 | $5 | $683 |
| Jan ’23 | 0 | 412 | 32,310 | $761 | $13 | $774 |
This is a fresh domain with a relevant aged-domain redirected to a relevant silo on the site.
I’ll admit that I felt disheartened with the traffic plateau that seems to have lasted for about 4 months. With a bit of luck, it might be emerging from that now. Traffic went up a good bit in January, earnings didn’t increase by the same percentage because of January ad rates being traditionally lower.
Income Summary
Overall Earnings This Month By Niche Site
- Site 1: $973 ( previous month $2,186 )
- Site 2: $339 ( previous month $292 )
- Site 5: $774 ( previous month $683 )
Total Earnings From This Selection of Sites: $2,086 ( previous month $3,253 )
Niche Website Earnings by Source
- Ezoic Display Ads: $1,495 ( previous month $1,716 )
- Affiliate: $591 ( previous month $1,537 )
Outgoings
Running any website or blog involves having expenses. I could run extremely lean and just have my hosting costs if I wanted.
However, I’m playing the long game, and I don’t mind paying for tools/services that save me time and mental energy and make the blogging journey a little easier.
Breakdown of Expenses For This Month
Like many others in the industry, I don’t view content costs as an expense. Investing in good content is exactly that – an investment in the site. I’ll list my content costs separately below.
Here’s a quick breakdown of my running costs this month:
- Virtual Assistant (VA) (OnlineJobs.ph) : $73
- Team Content Order Management (Trello) : $54
- Plagiarism Checker (CopyLeaks) : $35
- Domain (NameCheap) : $10
- Hosting (CloudWays) : $36
- Site Management / Backups (ManageWP) : $13
- Theme (GeneratePress) : $5 ($59 paid annually)
- Plugin: (Link Whisper) : $14 (I have a 10-site license)
- Affiliate Tables & Link Checker (Lasso): $111
- Premium fee for Ezoic : $96
- Social Media Scheduling (Metricool) : $12
- Graphics (Canva Pro) : $12
- Keyword Research (Ahrefs) : $99
- Rank Tracker (SERPRobot) : $10
Content Investment
I’ve built my own team of freelance writers. I manage them via Trello & Slack. I pay a maximum of 3 cents per word for the content they produce.
I’m very happy with the quality.
Content Investment in Current Month
- Site 1: $116.44
- Site 2: $0
- Site 5: $0
- TOTAL Estimated Content Investment this month: $116
Note: The content costs are estimated based on the published word count. The figure might change slightly when all of their invoices come in. This is a rough estimate, but it’s probably reasonably close.
That’s the end of the income report.
See you next month!