
If you’re thinking of starting a blog or niche website, you’re probably curious about how much it can potentially earn.
While every website is different, so too is every niche and site operator. The entire process of building a blog is incredibly nuanced.
There is NO framework that can guarantee absolute success, but this one mega course comes really close, in my opinion.
With that said, I’ve created this blogging income report series to help track my personal journey. Your journey could be very different.
NOTE: This income report does NOT include any income from my Minted Empire brand (this blog, my newsletter, and my YouTube Channel). Minted Empire is something I do in my spare time, and any income I earn here usually ends up being reinvested into my niche sites.
Let’s dive in!
Overview of October 2022’s Performance
What a blast these past couple of months have been! 4 Google Updates! (Helpful Content, Broad Core, Product Update, and then a Spam Update).
All of my sites were affected. Some more so than others. That sucks, but it’s part of the game.
This month saw an overall increase in earnings, which was due to an increase in affiliate commissions.
Site Breakdown
This income report covers 5 websites. I have 6 sites in total, but the newest one isn’t earning anything yet. I’ll add it to future income reports when it has some traffic worth mentioning.
(If you don’t want to read the detailed breakdown for each site, you can skip ahead to the summary.)
Site 1: Performance Report
Started: June 2020
Niche: Hobby / Tech
Monetization: Display Ads (Ezoic) & Affiliate (mostly Amazon Associates)
| Month | New Posts | Total Posts | Pageviews | Ads $ | Affiliate $ | Total $ |
| Jun ’20 | 3 | 3 | 202 | – | – | – |
| Jul ’20 | – | 3 | 336 | – | – | – |
| Aug ’20 | 4 | 7 | 48 | – | – | – |
| Sep ’20 | – | 7 | 22 | – | – | – |
| Oct ’20 | – | 7 | 54 | – | – | – |
| Nov ’20 | 1 | 8 | 254 | – | – | – |
| Dec ’20 | 2 | 10 | 271 | – | – | – |
| Jan ’21 | 6 | 16 | 434 | $1 | – | $1 |
| Feb ’21 | 6 | 22 | 536 | $3 | – | $3 |
| Mar ’21 | 7 | 29 | 2,643 | $14 | $1 | $15 |
| Apr ’21 | 11 | 40 | 4,504 | $34 | $46 | $80 |
| May ’21 | 10 | 50 | 7,601 | $67 | $382 | $449 |
| Jun ’21 | 5 | 55 | 7,117 | $80 | $286 | $366 |
| Jul ’21 | 0 | 55 | 9,534 | $125 | $383 | $508 |
| Aug ’21 | 4 | 59 | 12,903 | $148 | $394 | $542 |
| Sep ’21 | 0 | 59 | 15,336 | $175 | $406 | $581 |
| Oct ’21 | 3 | 62 | 16,735 | $206 | $701 | $907 |
| Nov ’21 | 28 | 90 | 19,458 | $346 | $376 | $722 |
| Dec ’21 | 62 | 152 | 14,170 | $280 | $473 | $753 |
| Jan ’22 | 36 | 188 | 12,713 | $173 | $210 | $383 |
| Feb ’22 | 1 | 189 | 10,899 | $137 | $348 | $485 |
| Mar ’22 | – | 189 | 13,587 | $154 | $516 | $670 |
| Apr ’22 | 4 | 193 | 21,844 | $184 | $430 | $614 |
| May ’22 | 30 | 223 | 29,626 | $305 | $347 | $652 |
| Jun ’22 | 23 | 246 | 30,894 | $492 | $499 | $991 |
| Jul ’22 | 12 | 258 | 39,760 | $546 | $830 | $1,376 |
| Aug ’22 | 5 | 263 | 45,232 | $731 | $671 | $1,402 |
| Sep ’22 | 10 | 273 | 43,012 | $917 | $609 | $1,526 |
| Oct’ 22 | 17 | 290 | 39,881 | $860 | $905 | $1,765 |
Site 1 has a start/stop history. After working on it for a few months in 2020, I didn’t see any traction (that’s normal), and I decided to pause working on it (I regret that now).
Site 1 is in an incredibly competitive niche dominated by massive global companies. I do have an interest in the niche, but knowing what I know now, I probably would have entered a less competitive space.
At the beginning of 2021, I decided to give Site 1 another shot, but I didn’t go all in because I was distracted by other sites and other shiny objects. In November 2021, I went fully in on Site 1.
Site 2: Performance Report
Started: September 2020
Niche: Lifestyle
Monetization: Display Ads (Ezoic), Other Affiliate
| Month | New Posts | Total Posts | Pageviews | Ads $ | Affiliate $ | Total $ |
| Sep ’20 | 10 | 10 | 142 | – | – | – |
| Oct ’20 | 10 | 20 | 571 | $1 | – | $1 |
| Nov ’20 | – | 20 | 466 | $4 | – | $4 |
| Dec ’20 | – | 20 | 542 | $9 | $5 | $14 |
| Jan ’21 | 1 | 21 | 499 | $5 | $1 | $6 |
| Feb ’21 | 6 | 27 | 513 | $5 | $4 | $9 |
| Mar ’21 | 4 | 31 | 1,627 | $7 | $1 | $8 |
| Apr ’21 | – | 31 | 2,492 | $12 | $32 | $44 |
| May ’21 | 6 | 37 | 3,690 | $41 | $67 | $108 |
| Jun ’21 | 7 | 44 | 3,938 | $53 | $63 | $116 |
| Jul ’21 | 12 | 56 | 5,870 | $91 | $7 | $98 |
| Aug ’21 | 1 | 57 | 6,529 | $92 | $17 | $109 |
| Sep ’21 | – | 57 | 6,367 | $91 | $3 | $94 |
| Oct ’21 | – | 57 | 6,503 | $91 | $7 | $98 |
| Nov ’21 | – | 57 | 6,114 | $110 | $106 | $216 |
| Dec ’21 | – | 57 | 4,919 | $88 | – | $88 |
| Jan ’22 | – | 57 | 6,618 | $110 | $36 | $146 |
| Feb ’22 | 3 | 60 | 6,473 | $90 | $35 | $125 |
| Mar ’22 | 16 | 76 | 8,115 | $96 | $1 | $97 |
| Apr ’22 | 7 | 83 | 9,219 | $134 | $61 | $195 |
| May ’22 | 6 | 89 | 13,639 | $223 | $33 | $256 |
| Jun ’22 | 8 | 97 | 18,779 | $350 | $172 | $522 |
| Jul ’22 | 7 | 104 | 21,624 | $354 | $96 | $450 |
| Aug ’22 | 1 | 105 | 28,694 | $593 | $46 | $639 |
| Sep ’22 | 7 | 112 | 35,042 | $1,043 | $40 | $1,083 |
| Oct ’22 | 9 | 121 | 29,316 | $766 | $156 | $922 |
There is a seasonality factor with the posts that were published this year. I think this explains a good bit of the drop this month. The topics seeing less traffic lately are seasonal.
Site 3: Performance Report
Started: December 2020
Niche: Pets
Monetization: Display Ads (Ezoic)
| Month | New Posts | Total Posts | Pageviews | Ads $ | Affiliate $ | Total $ |
| Dec ’20 | 16 | 16 | 42 | – | – | – |
| Jan ’21 | 14 | 30 | 271 | $1 | – | $1 |
| Feb ’21 | 20 | 50 | 665 | $6 | – | $6 |
| Mar ’21 | 12 | 62 | 1,672 | $5 | $1 | $6 |
| Apr ’21 | – | 62 | 2,200 | $10 | – | $10 |
| May ’21 | – | 62 | 2,946 | $32 | – | $32 |
| Jun ’21 | – | 62 | 4,276 | $50 | $4 | $54 |
| Jul ’21 | – | 62 | 5,216 | $73 | – | $73 |
| Aug ’21 | 16 | 78 | 4,402 | $53 | – | $53 |
| Sep ’21 | – | 78 | 4,450 | $49 | $3 | $52 |
| Oct ’21 | 18 | 96 | 4,203 | $46 | $3 | $49 |
| Nov ’21 | – | 96 | 3,751 | $65 | $2 | $67 |
| Dec ’21 | – | 96 | 5,474 | $90 | – | $90 |
| Jan ’22 | – | 96 | 5,933 | $72 | $3 | $75 |
| Feb ’22 | – | 96 | 5,579 | $61 | $1 | $62 |
| Mar ’22 | 6 | 102 | 5,760 | $66 | $1 | $67 |
| Apr ’22 | 7 | 109 | 5,867 | $70 | $3 | $73 |
| May ’22 | 12 | 121 | 6,186 | $73 | – | $73 |
| Jun ’22 | – | 121 | 9,116 | $117 | $1 | $118 |
| Jul ’22 | 5 | 126 | 12,247 | $162 | $2 | $164 |
| Aug ’22 | – | 126 | 9,244 | $126 | – | $126 |
| Sep ’22 | – | 126 | 9,625 | $263 | $2 | $265 |
| Oct ’22 | – | 126 | 5,390 | $96 | $4 | $100 |
As you can see, this site took a decent hit with all of the updates. It had been enjoying some decent Google Discover traffic in previous months. The randomness of Google Discover is a tough one to crack. I’ve put this site on hold for a while.
Site 4: Performance Report
Started: March 2021
Niche: Not disclosed!
Monetization: Display Ads (Ezoic)
| Month | New Posts | Total Posts | Pageviews | Ads $ | Affiliate $ | Total $ |
| Mar ’21 | 12 | 12 | 23 | – | – | – |
| Apr ’21 | 5 | 17 | 20 | – | – | – |
| May ’21 | 4 | 21 | 14 | – | – | – |
| Jun ’21 | – | 21 | 17 | – | – | – |
| Jul ’21 | – | 21 | 13 | – | – | – |
| Aug ’21 | 9 | 30 | 39 | – | – | – |
| Sep ’21 | 6 | 36 | 37 | – | – | – |
| Oct ’21 | – | 36 | 35 | – | – | – |
| Nov ’21 | – | 36 | 45 | – | – | – |
| Dec ’21 | – | 36 | 379 | – | – | – |
| Jan ’22 | – | 36 | 321 | – | – | – |
| Feb ’22 | – | 36 | 557 | – | $1 | $1 |
| Mar ’22 | – | 36 | 1,087 | – | – | – |
| Apr ’22 | – | 36 | 1,553 | $5 | – | $5 |
| May ’22 | 7 | 43 | 2,795 | $24 | – | $24 |
| Jun ’22 | 6 | 49 | 4,339 | $36 | $1 | $37 |
| Jul ’22 | 2 | 51 | 4,707 | $23 | – | $23 |
| Aug ’22 | 7 | 58 | 5,288 | $32 | – | $32 |
| Sep ’22 | 8 | 66 | 2,329 | $17 | – | $17 |
| Oct ’22 | 8 | 74 | 1,789 | $14 | $1 | $15 |
Despite continuing to publish on this site over the past 6 months, it has been adversely affected by the recent Google updates. It’s on hold until I see what happens with it.
Site 5: Performance Report
Started: January 2022 (with some seed content posted during Summer 2021)
Niche: Not disclosed!
Monetization: Display Ads (Ezoic)
| Month | New Posts | Total Posts | Pageviews | Ads $ | Affiliate $ | Total $ |
| Summer ’21 | 46 | 46 | 6,654 (July to Dec ’21) | – | – | – |
| Jan ’22 | 42 | 88 | 1,849 | – | – | – |
| Feb ’22 | 106 | 194 | 2,178 | – | – | – |
| Mar ’22 | 27 | 221 | 3,063 | – | – | – |
| Apr ’22 | 7 | 228 | 4,559 | $91 | – | $91 |
| May ’22 | 19 | 247 | 5,704 | $154 | – | $154 |
| Jun ’22 | 39 | 286 | 7,469 | $244 | – | $244 |
| Jul ’22 | 32 | 318 | 12,675 | $348 | $56 | $404 |
| Aug ’22 | 23 | 341 | 23,562 | $568 | $49 | $616 |
| Sep ’22 | 28 | 369 | 24,240 | $766 | $49 | $815 |
| Oct ’22 | 34 | 403 | 26,081 | $862 | $107 | $969 |
This is a fresh domain with a relevant aged-domain redirected to a relevant silo on the site. Traffic is slightly up, ad rates went way up again. This site has great potential, and I’m hopeful that it will soon come out of this current plateau.
Income Summary
Overall Earnings This Month By Niche Site
- Site 1: $1,765 ( previous month $1,527 )
- Site 2: $922 ( previous month $1,097 )
- Site 3: $100 ( previous month $266 )
- Site 4: $15 ( previous month $17 )
- Site 5: $969 ( previous month $815 )
Total Earnings From This Selection of Sites: $3,771 ( previous month $3,722 )
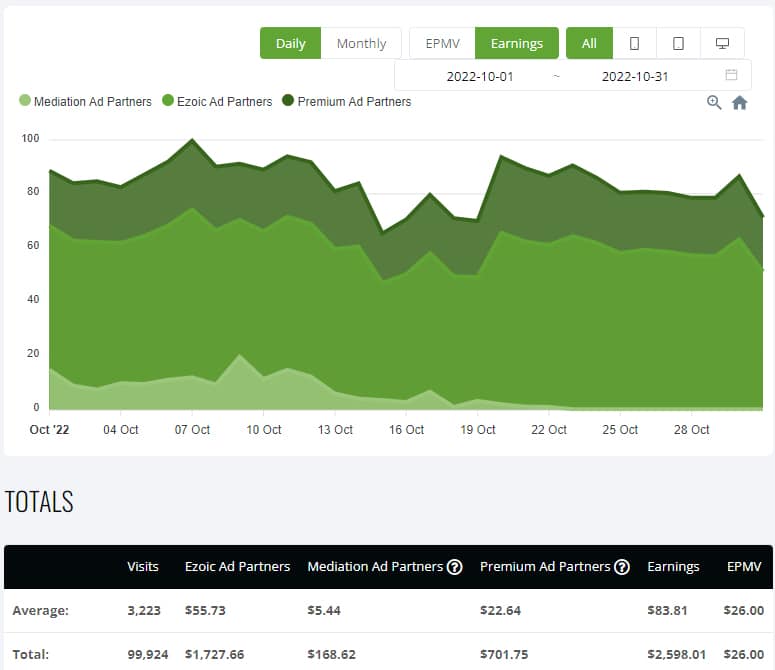
Niche Website Earnings by Source
- Ezoic Display Ads: $2,598 ( previous month $3,006 )
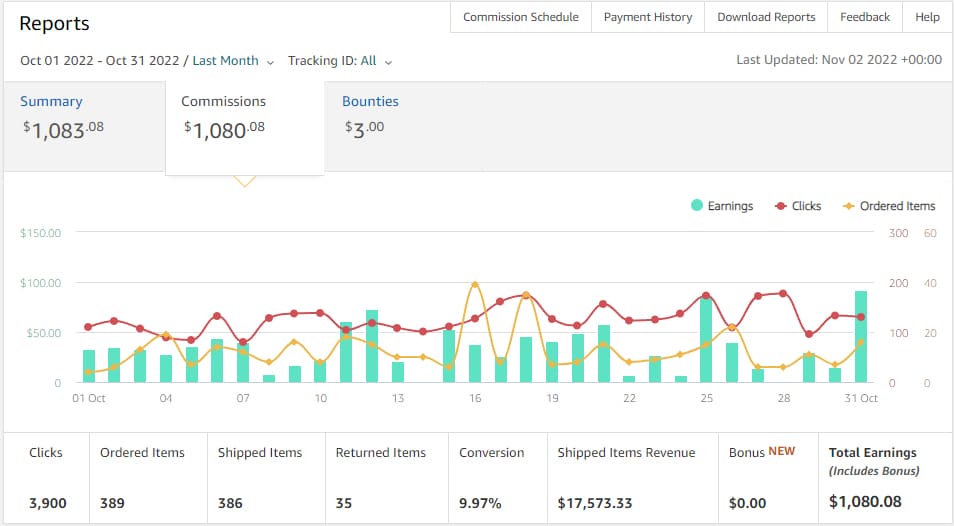
- Affiliate: $1,173 [Amazon $1,083, Other $90] ( previous month affiliate total $715 )
Outgoings
Running any website or blog involves having expenses. I could run extremely lean and just have my hosting costs if I wanted.
However, I’m playing the long game, and I don’t mind paying for tools/services that save me time and mental energy and make the blogging journey a little easier.
Breakdown of Expenses For This Month
Like many others in the industry, I don’t view content costs as an expense. Investing in good content is exactly that – an investment in the site. I’ll list my content costs separately below.
Here’s a quick breakdown of my running costs this month:
- Virtual Assistant (VA) (OnlineJobs.ph) : $73
- Team Content Order Management (Trello) : $54
- Plagiarism Checker (CopyLeaks) : $35
- Domain (NameCheap) : $10
- Hosting (CloudWays) : $36
- Site Management / Backups (ManageWP) : $13
- Theme (GeneratePress) : $5 ($59 paid annually)
- Plugin: (Link Whisper) : $14 (I have a 10-site license)
- Affiliate Link Checker (AMZ Watcher) : $17
- Premium fee for Ezoic : $575
- Social Media Scheduling (Metricool) : $12
- Graphics (Canva Pro) : $12
- Keyword Research (Ahrefs) : $99
- Rank Tracker (SERPRobot) : $10
Content Investment
I’ve built my own team of freelance writers. I manage them via Trello & Slack. I pay a maximum of 3 cents per word for the content they produce.
I’m very happy with the quality.
Content Investment in Current Month
- Site 1: $680
- Site 2: $147
- Site 3: $0
- Site 4: $239
- Site 5: $470
- TOTAL Estimated Content Investment this month: $1,536
Note: The content costs are estimated based on the published word count. The figure might change slightly when all of their invoices come in. This is a rough estimate, but it’s probably reasonably close.
That’s the end of the income report.
See you next month!